
Wall Chart
Charts: Grouping & Graphing Data
The Charts layout lets you visualize and analyze your data by organizing your contact records into meaningful segments and displaying these segments as charts. Organizers also call it a wall chart. With this tool, union organizers and grassroots organizations can easily identify patterns, track engagement, and inform strategy based on real-time insights.
Using Group By and Graph By
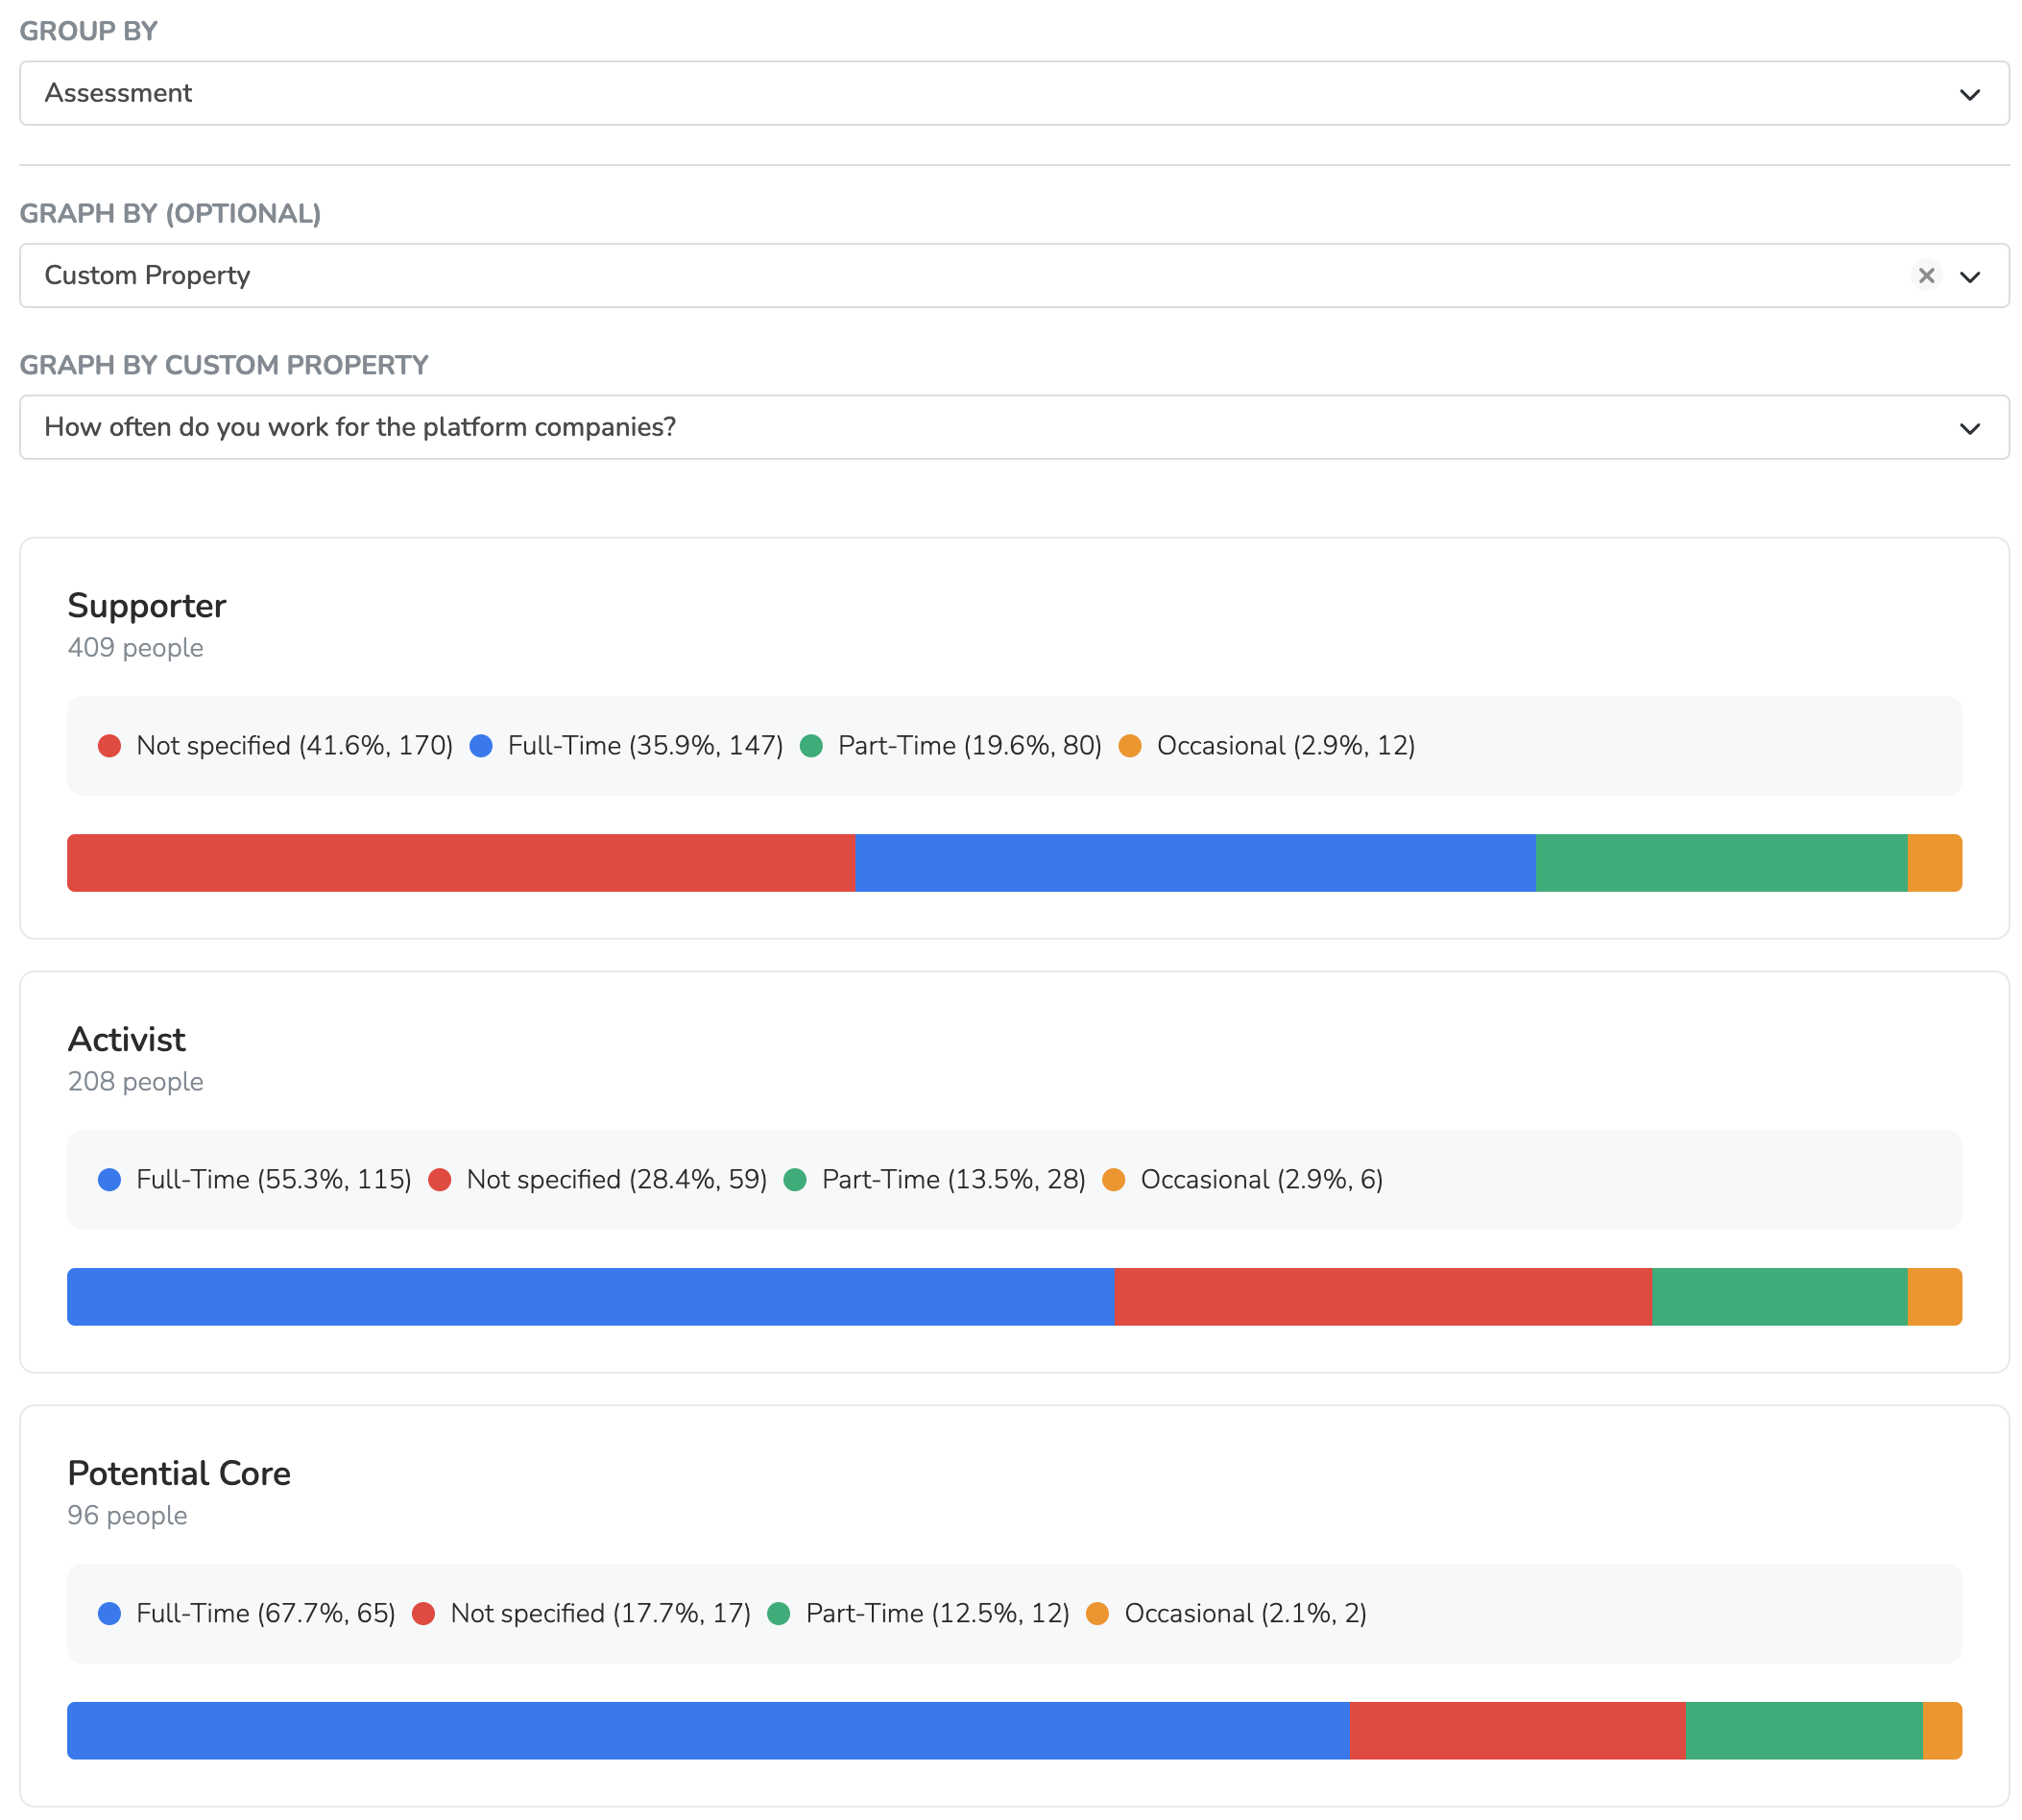
On the People page, pick the Charts layout. In Charts, set two options:
- Group By: Select an attribute (e.g., Chapter, Assessment, Custom Property) to form distinct groups of people.
- Graph By: Choose a second attribute to break down each of those groups, helping you explore underlying patterns.
Note: Graph By (Optional) offers every Group By attribute. Custom properties are unique fields defined by your organization.
Available Attributes
You can Group and Graph by attributes in the following categories:
- Person: Assessment, Custom Property, Preferred Language, Secondary Language, Chapter, Agent Assignment, Account Creation Year, Account Creation Method
- Location: Branch, Legislative District (if your organization has legislative districts), State, Postal Code. In Group By, Branch shows only on plans with branches, such as Professional and Enterprise.
- Interactions: Have We Spoken, Submitted Page Form, Most Referred New People, Most Referred Page Submissions
Example Use Cases
-
Analyzing Engagement by Department:
Group by your organization’s Department (if defined as a custom property) and Graph by Assessment to quickly identify which departments have the highest concentration of active supporters versus those needing more engagement. -
Regional Trends in Member Activity:
Group by Branch and Graph by Preferred Language to understand how language needs vary by location, helping you tailor materials and outreach for each area. This example needs branches.
Sharing Your Charts
To share a specific chart configuration with your team, simply copy and share the page’s URL. Only team members who are logged in can open it. Each viewer sees counts for their own logged in scope and permissions.
By combining Group By and Graph By options, you can create powerful visual insights into your members, enabling more informed, targeted, and effective organizing.
Updated 2 days ago