
Activity Overview
The Overview section displays key activity metrics for a specific date range. You can view data for dozens of different activity metrics during the specified range, and even compare it to previous periods.
Like all pages in the dashboard, the main content is relative to your logged in Scope. You add or remove tiles and customize their order, then save them to easily return to a useful Report. Each save creates a new report, and you cannot update or delete a saved report.
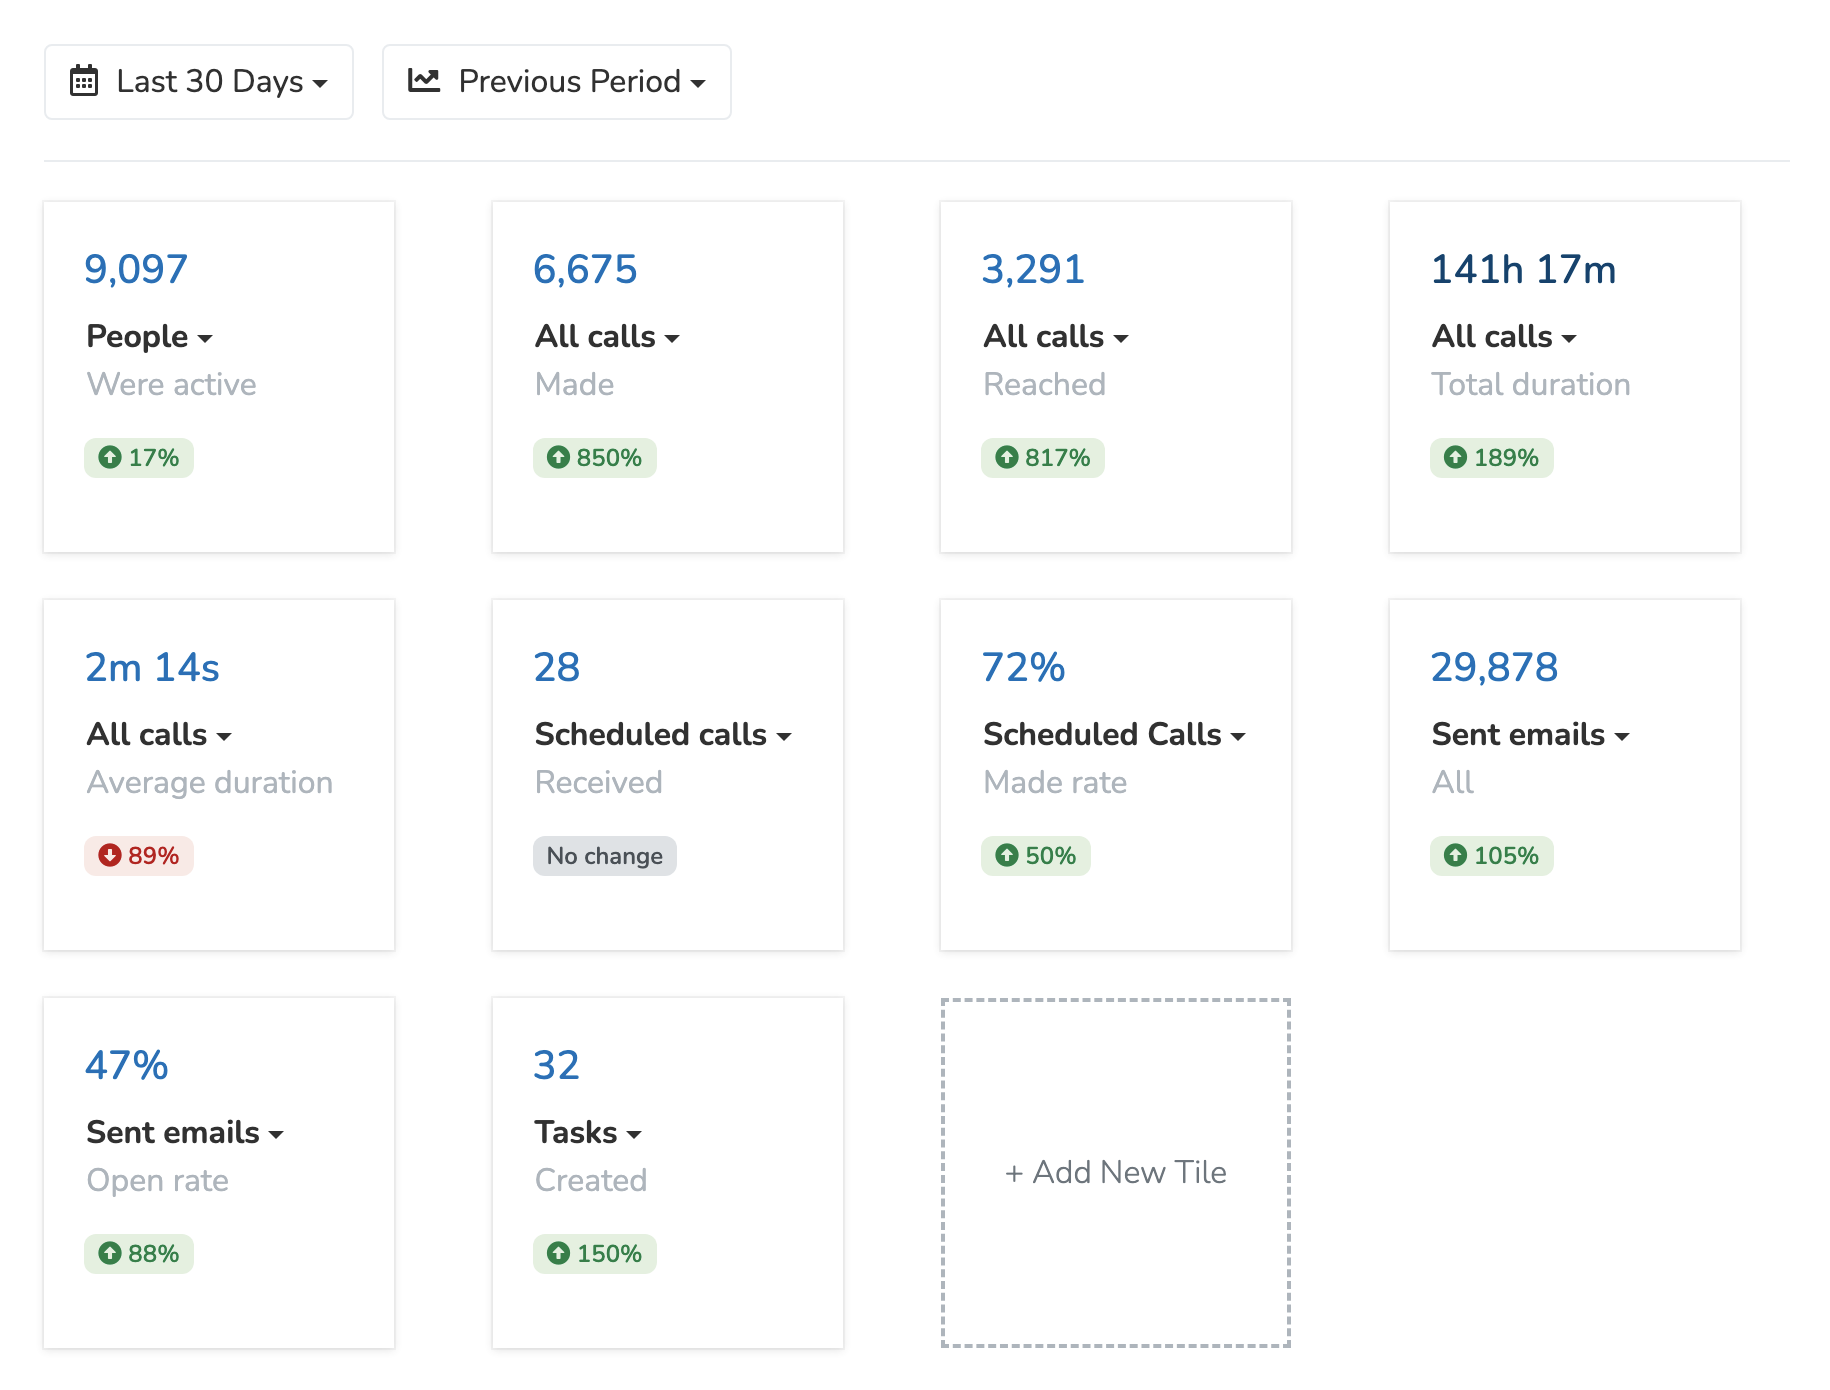
You can choose from a set of 30+ pre-set tiles to view exactly the data you want to see at a glance from the Overview. 'Texts / Revoked' counts SMS permission revokes, and 'People / Were active' counts people with any activity in the range. A text that you send to a person is not activity for that person. To ask for a new tile, post a feature request at https://feedback.solidarity.tech/feature-requests.
Filtering by Saved List
To limit the tiles to one audience, pick a saved list from the 'All People' button at the top right. When a list is active, the standard tiles and the configurable tiles count only the people on that list. The list does not change the summary tiles, 'Team Members / Added', or 'Page Visits'.
Some tiles measure agent-level or anonymous activity that has no member dimension, for example, new Team Members added or page visits. While a list is active, such a tile can show a small info icon (ⓘ) that says the tile is not filtered by the list.
To return to org-wide metrics, select All People from the dropdown.
Summary Tiles
In addition to standard metric tiles, the Overview now includes larger summary tiles that provide richer context:
- Top Texters / Top Callers - Leaderboards showing your most active team members
- Recent Donations - List of recent donations with total raised
- Upcoming Events - Events with future sessions and RSVP counts
- Active Phonebanks / Active Textbanks list the banks with the most contact attempts in the selected range.
- Recent Email Blasts / Recent Text Blasts list the blasts sent in the selected range, with a 'sent' count for each blast.
- Event Dashboard - Select any event to see RSVPs and all promotional outreach (phone banking, text banking, email blasts, and text blasts that promoted the event)
- Email Stats by Campaign Tag: Select a campaign tag to see 'Blasts', 'Delivered', 'Open Rate', and 'Click Rate' for the email blasts with that tag sent in the selected range
- Attendance by Event Tag - Select an event tag to see show rate trends and per-session breakdowns across all events with that tag. The tile displays aggregate Yes RSVPs, total attended, and overall show rate (with a comparison to the previous period if one is selected), a trend chart, and a per-session list showing the show rate for each individual session. Toggle between the chart and session list views using the segmented control on the tile.
Summary tiles take up a 2x2 space and can be reordered alongside regular tiles by dragging the grip handle at the bottom left of each tile.
Configurable Tiles
Some tiles require you to select a specific entity before they display data. These configurable tiles include:
- Phonebank Attempted / Phonebank Reached - Select a phonebank to see how many contacts were attempted or reached during the selected period.
- Phonebank RSVPs - Select a phonebank to see the total number of Yes RSVPs gained through that phonebank during the selected period. This counts RSVPs to any event recorded by an agent while working contacts in that phonebank.
- Textbank Contacted - Select a textbank to see how many contacts were messaged during the selected period.
- Form Submissions / Page Visits - Select a page to see submission or visit counts.
- Event Yes RSVPs / Session RSVPs - Select an event or session to see Yes RSVP counts.
Updated 3 days ago